Inspired by Tufts' gerrymandering school, I decided to take a stab at some of the math on my own. It turned out to be largely programming instead, but that ended up being interesting on its own.
hgis is a GIS tool written in haskell. It's meant to compute display congressional
district information, including perimeters, areas, and maps. As it stands, it's
a work in progress, but it can do one very important thing already, namely:
measuring compactness.
hgis is a command-line tool so you'll need to have some
familiarity to use it.
The installation instructions are available here.
The data we'll be using comes from this page. You'll want to download the shapefile and the geodatabase, and you should put them in the same directory. The past eight congresses are online, so you can look at the evolution of districts over time, which is of course useful if you're trying to prove gerrymandering.
On to the fun part: we can start by making maps just to ensure that everything we're doing is sensible. Type:
$ hgis map -o map.png tl_2016_us_cd115.shp
hgis currently can write .png and .svg files, and will detect which you
want by filename extension. You're probably going to also want to set the
projection; we'll go with the Winkel III projection:
$ hgis map -o map.png -p winkel3 tl_2016_us_cd115.shp
If you get stuck on something, type hgis --help or hgis map --help.
With any luck, at this point you'll have a map:
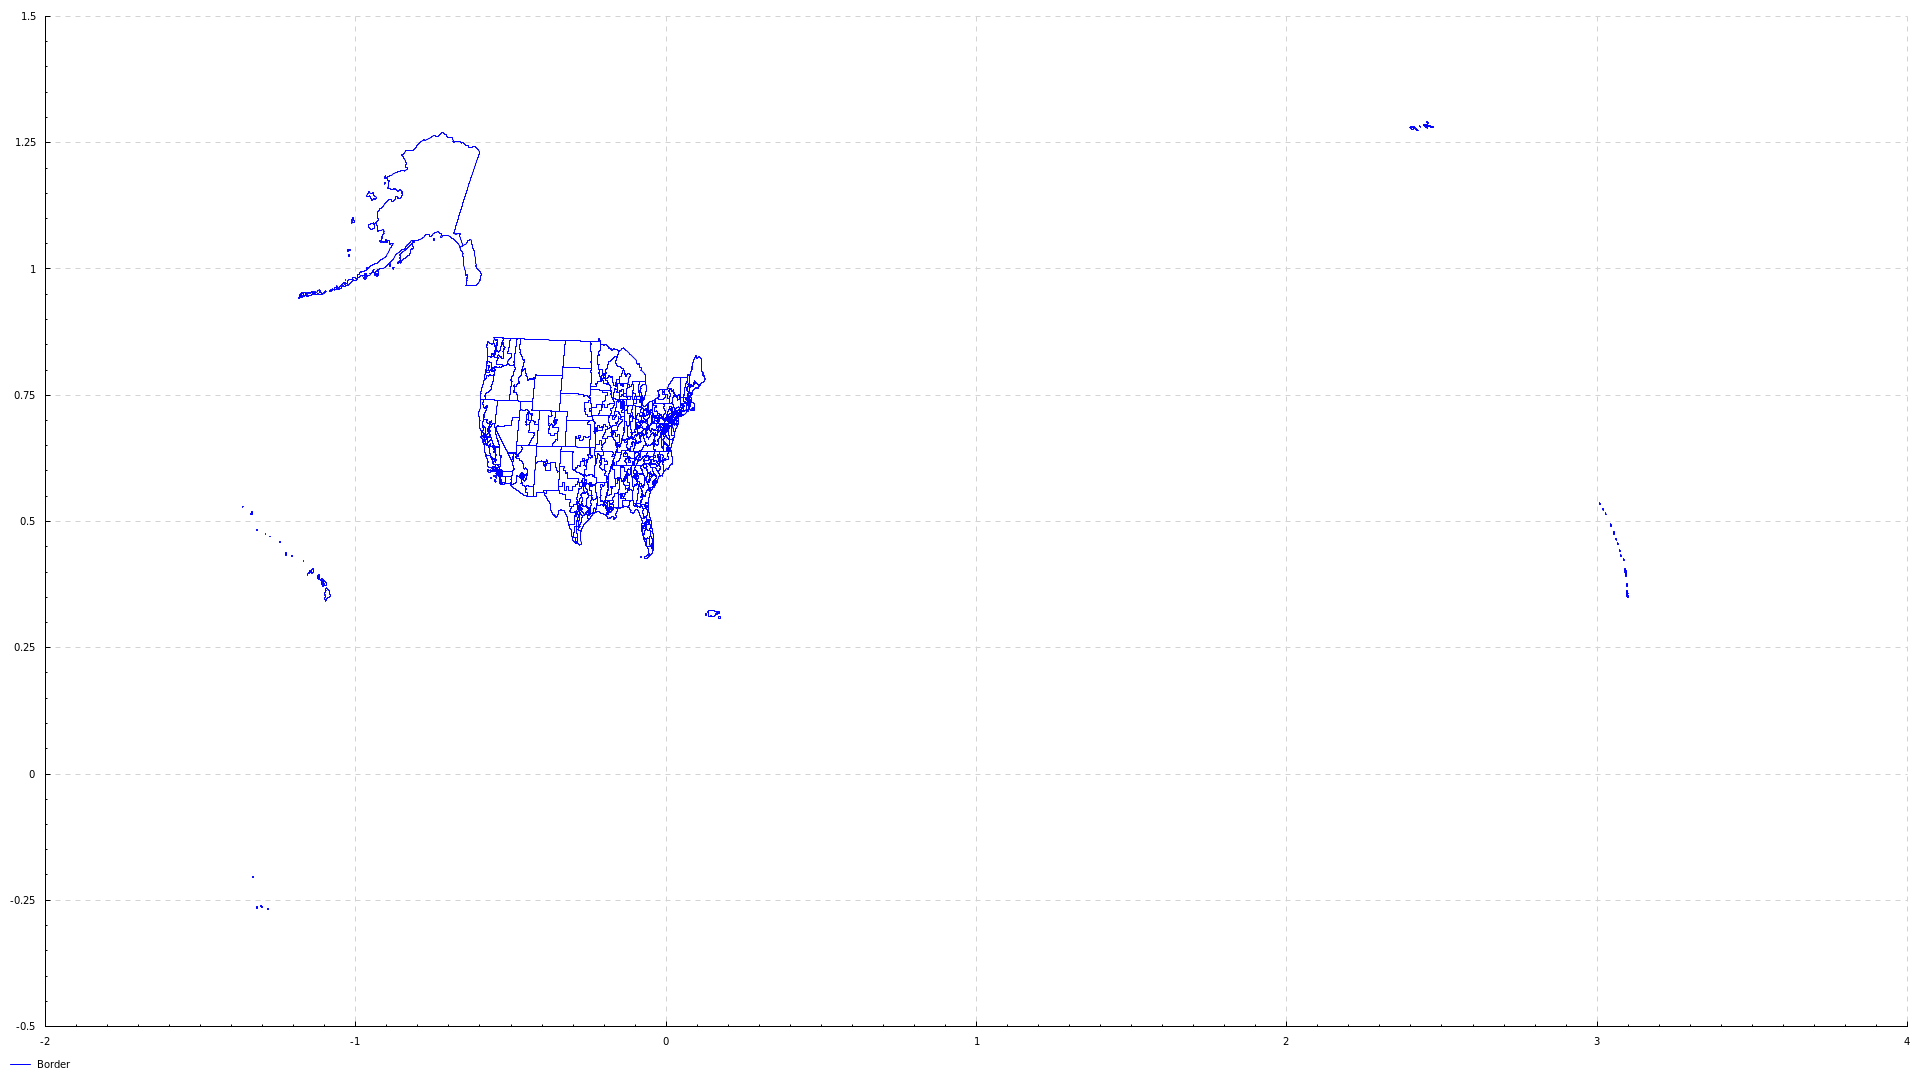
Since everything looks sane, we can proceed.
At the moment, hgis has three computations: perimeter, area, and (relative) compactness. You can try
hgis compute perimeter tl_2016_us_cd115.shp
("CongressionalDistrict(atLarge)",18094.74527952693)
("CongressionalDistrict(atLarge)",419.81594015021847)
("CongressionalDistrict(atLarge)",3152.631826127492)
("CongressionalDistrict(atLarge)",2109.8202335994906)
...
and it will print out perimeters in km, alongside a label for each district. Unfortunately, the USGS didn't label the state alongside the district number. Thus, if you want these data on the map:
hgis maplabel -p winkel3 --label perimeter -o labelled.png perimeter tl_2016_us_cd115.shp
will make a map with each district labeled with its perimeter.
There's also the
hgis map -p winkel3 -o all/ tl_2016_us_cd115.shp
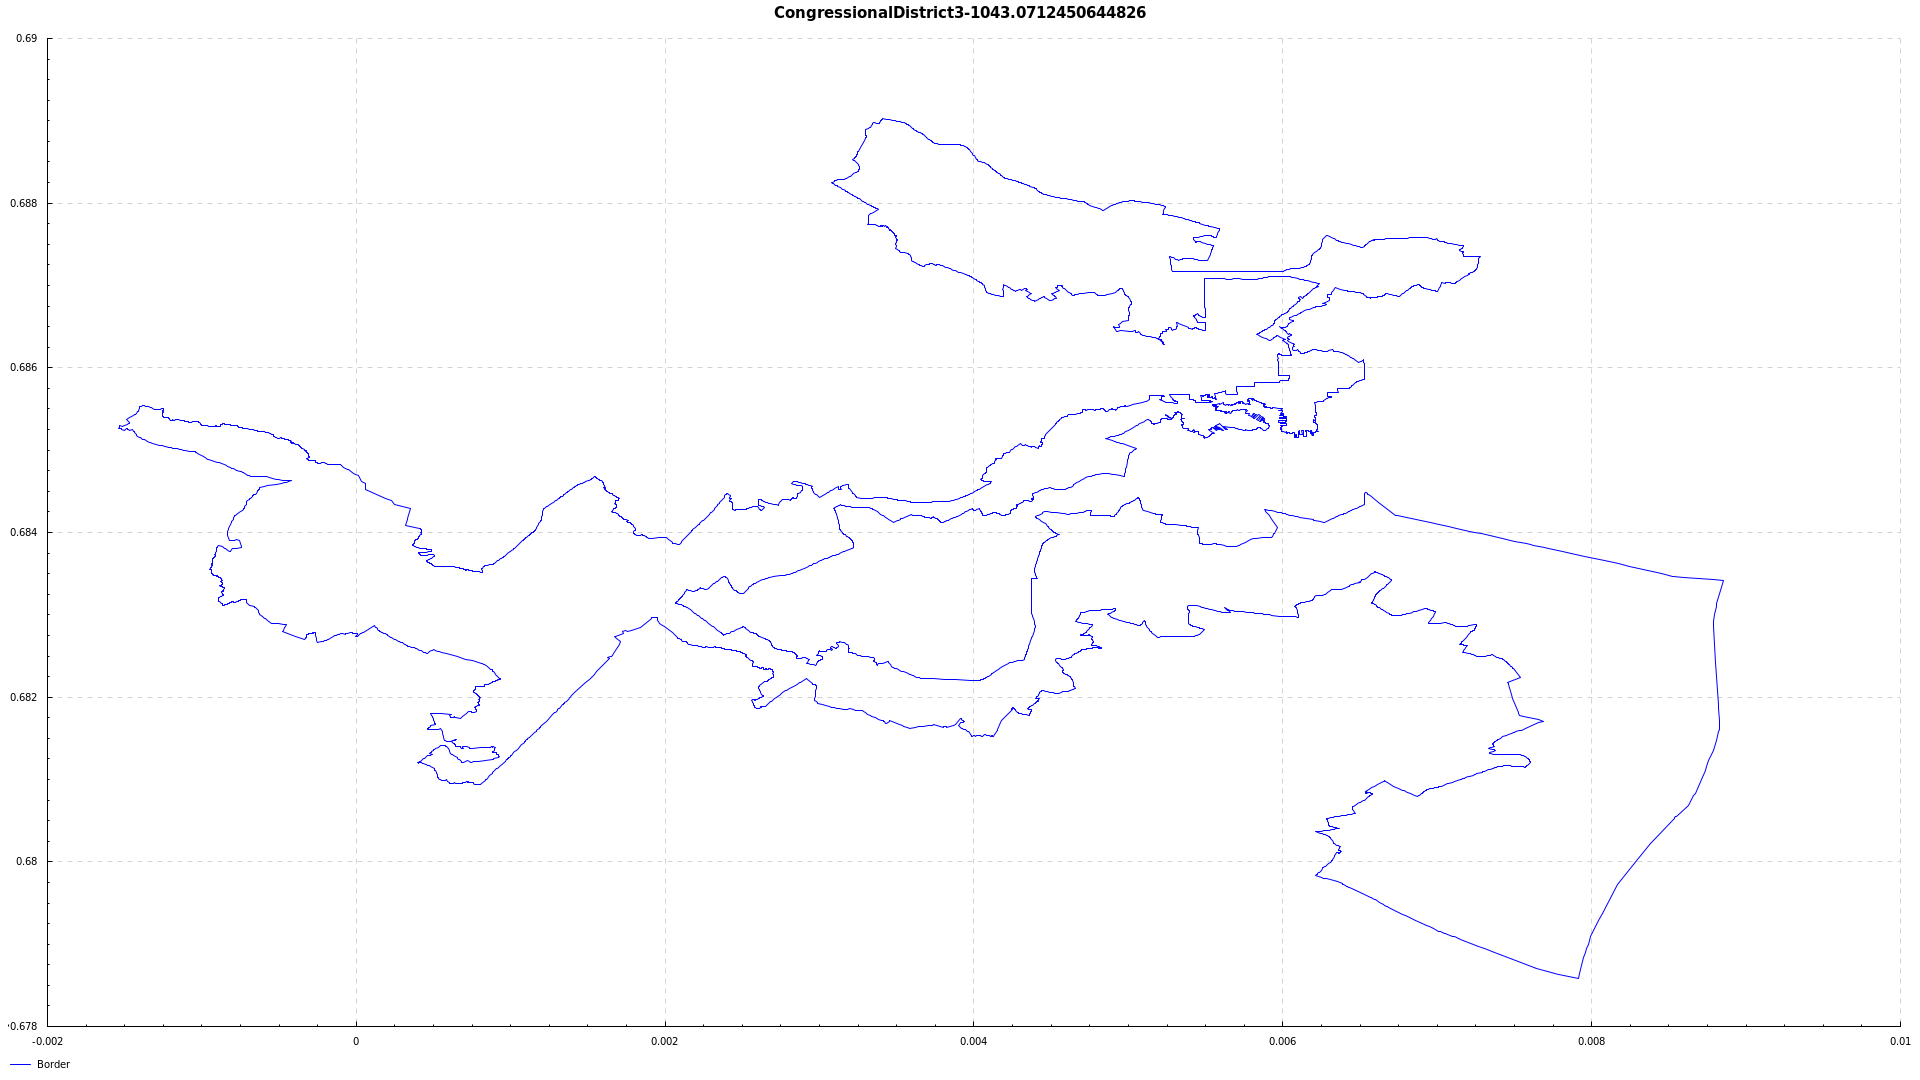
command, which allows you to make a separate image from each district, e.g. to look at Maryland's third congressional district in detail.
As of yet that's all the command-line tool can do. I hope to work on it more if I have time, but in the meanwhile, if you're interested in doing more with GIS/gerrymandering or more with Haskell you can find the package on hackage here. The library so far is pretty good for hacking, so it shouldn't be too hard to edit for your needs.
For the interested, here is the gerrymandering school, and here is Maryland's third congressional district in its full glory.

